Creating your first graph
Creating a basic graph in QPlot is just as easy as in Matlab or Octave. In fact, the first example from Octave’s plotting tutorial can be used almost directly:
x = -10:0.1:10;
qplot(x, sin(x));
(Type this at the Octave or Matlab command prompt.) A window similar to the one below should appear:
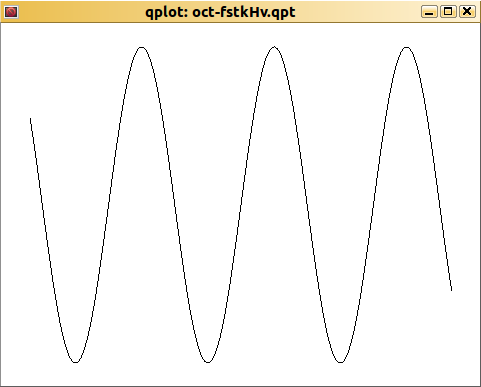
(If that does not happen, something is broken. Assuming that you can create native Matlab or Octave figures (try typing plot(x, sin(x));), the problem lies with your QPlot installation. Did you add QPlot to your search path?)
Installation problems out of the way? Let’s save our graph:
qsave MyFirstGraph.pdf
This produces a pdf file; you could also have saved your graph as a bitmap (jpeg, png, etc.) or as vector graphics (svg) just as easily.
This example has hopefully demonstrated that using QPlot is easy enough. But it probably hasn’t yet convinced you that you want to use QPlot. Please hang on, there is more to come.