About QPlot
QPlot is an alternative 2D plotting library for Python, Octave, and Matlab. It facilitates beautiful typography and precise axis scaling. QPlot is described in an article titled “Publication Quality 2D Graphs with Less Manual Effort due to Explicit Use of Dual Coordinate Systems,” (Wagenaar, 2014). QPlot may be obtained from github.com/wagenadl/qplot.Some examples
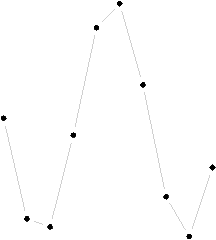
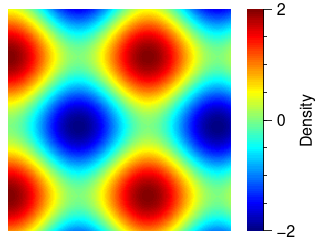
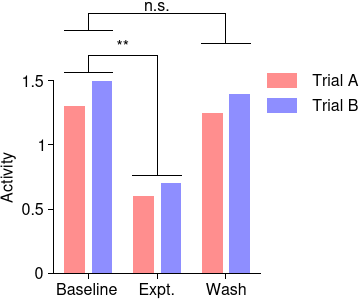
(Click on the examples to view as pdf.)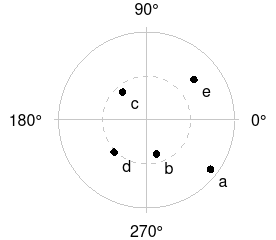
|
|
|
|
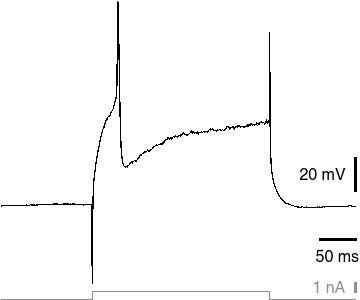
View Matlab code |